Realizing a cam description with the CAM Editor
A convenient way to define a cam description is to configure an object of the type "CAM Description" using the CAM Editor in the MOVIRUN® open Editor.
Adding objects of type "CAM Description"
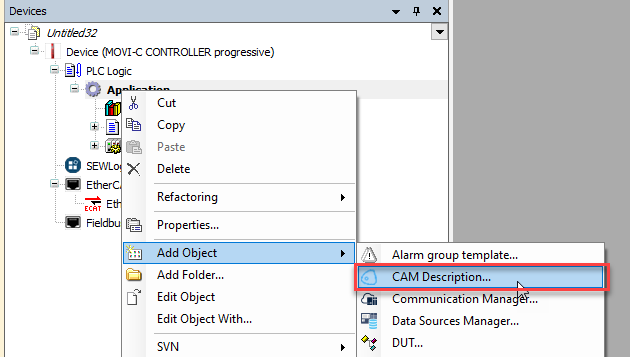
Objects of the "CAM Description" type can be added in the MOVIRUN® open Editor via the context menu of the application. The CAM Editor opens automatically after creating a new object, but can also be opened again at any time by double-clicking the device tree object.
Adding cam segments
Cam segments can be added or deleted in the CAM Editor via [Add segment] and [Remove segment].

Configuring the cam description
The following settings can be implemented for the cam segments. Depending on the set function and mode, different parameters can be set. The fields highlighted in blue cannot be edited with the currently selected setting.
Name | Description |
|---|---|
Function | Mathematical function of the cam segment:
|
Mode | Dynamic behavior at the segment boundaries. The letters describe the behavior at a segment boundary. With the settings "R-R", "R-M", "M-R" and "M-I", the 1st letter always refers to the behavior at the left segment boundary, the 2nd letter to the behavior at the right segment boundary.
|
X1 | Master position left segment boundary |
Y1 | Slave position left segment boundary |
Y´ | 1st derivative dy / dx at the left segment boundary |
Y´´ | 2nd derivative d2y/dx2 at the left segment boundary |
Y´´´ | 3rd derivative d3y/dx3 at the left segment boundary |
X2 | Master position right segment boundary |
Y2 | Slave position right segment boundary |
Y2´ | 1st derivative dy / dx at the right segment boundary |
Y2´´ | 2nd derivative d2y/dx2 at the right segment boundary |
Y2´´´ | 3rd derivative d3y/dx3 at the right segment boundary |
Defining diagram settings
The settings for the diagram can be configured in the "Plotting settings" area. To display values from the diagram (plot), move the cursor over the curve while holding down the left mouse button. The diagram can be zoomed using the mouse wheel.

Name | Description |
|---|---|
Position profile | Display position in the plot |
Velocity | Display velocity profile in the plot |
Acceleration | Display acceleration profile in the plot |
Jerk | Display jerk profile in the plot |
Scale plot | Scaling of the diagram:
|
Reset plot | Reset diagram to default setting |
Show tracker | Display master position in the diagram as a vertical line |
Velocity limit | Show speed limit of the slave axis. |
Acceleration limit | Acceleration limit of the slave axis is displayed. |
Setting the axis context
A cam description can be used in any combination of master and slave axes. Some properties, such as the user units or the configured application limits of a specific master-slave combination, can be represented by using this specific combination as the "axis context".
In this example, "VirtualAxis" is used as the master axis and "Axis1" as the slave axis. To apply this axis context, select the corresponding combination from the "Current axis context" list. The prerequisite for creating an axis context is that there are at least two axes in the IEC project in the form of a logical device.
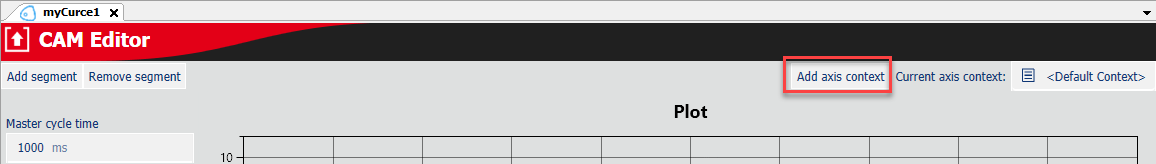
To create a new axis context, click [Add axis context].
In the dialog box that opens, you can select a master and a slave axis in the "MasterAxis" and "SlaveAxis" columns.
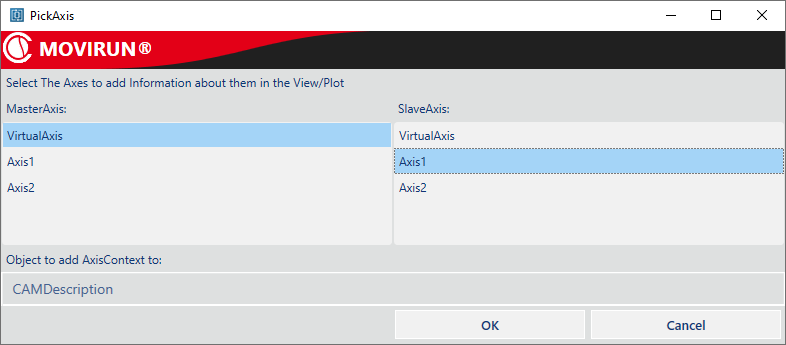
Click [OK] to accept the axis context and then select it.
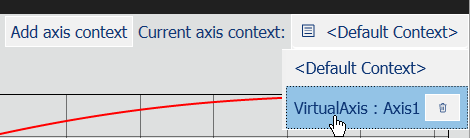
Several axis contexts can also be created or deleted again using the trash can icon. After selecting an axis context, the names and user units of the respective axis combination are shown in the display.
Validating application limits
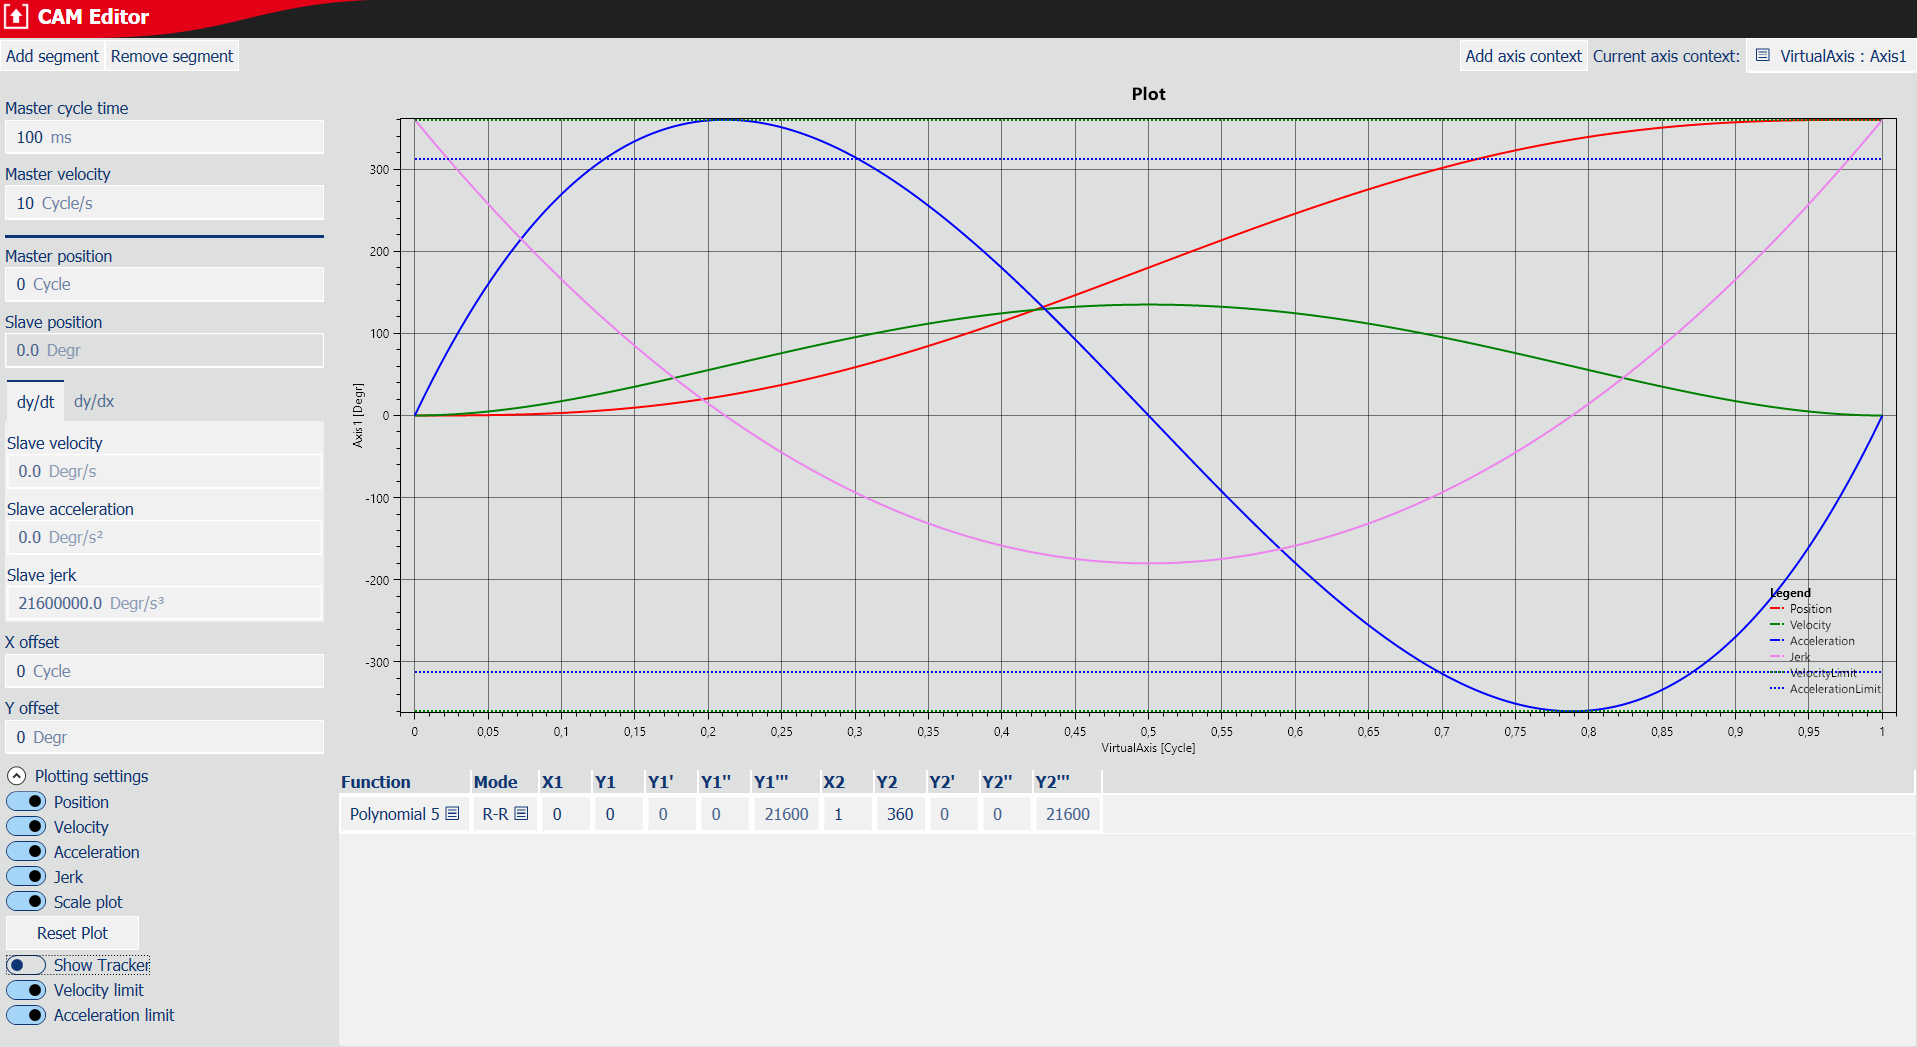
The configuration of the application limits (speed and acceleration) can be validated with the CAM Editor. To do this, it is necessary to specify the duration of a curve cycle in the "Master cycle time" field. The configured limits are displayed if they are activated in the "Plotting settings" via "Show Tracker".
In the following example, the acceleration profile (blue line) exceeds the configured limits (dashed blue lines), while the speed profile (green line) is still within the configured limits (green dashed line).
Reading values at a specific curve point
In some cases, it may be interesting to validate speeds or accelerations at a specific curve point. To do this, click in the diagram and move the mouse to the corresponding curve point (here: Master position 0.5).
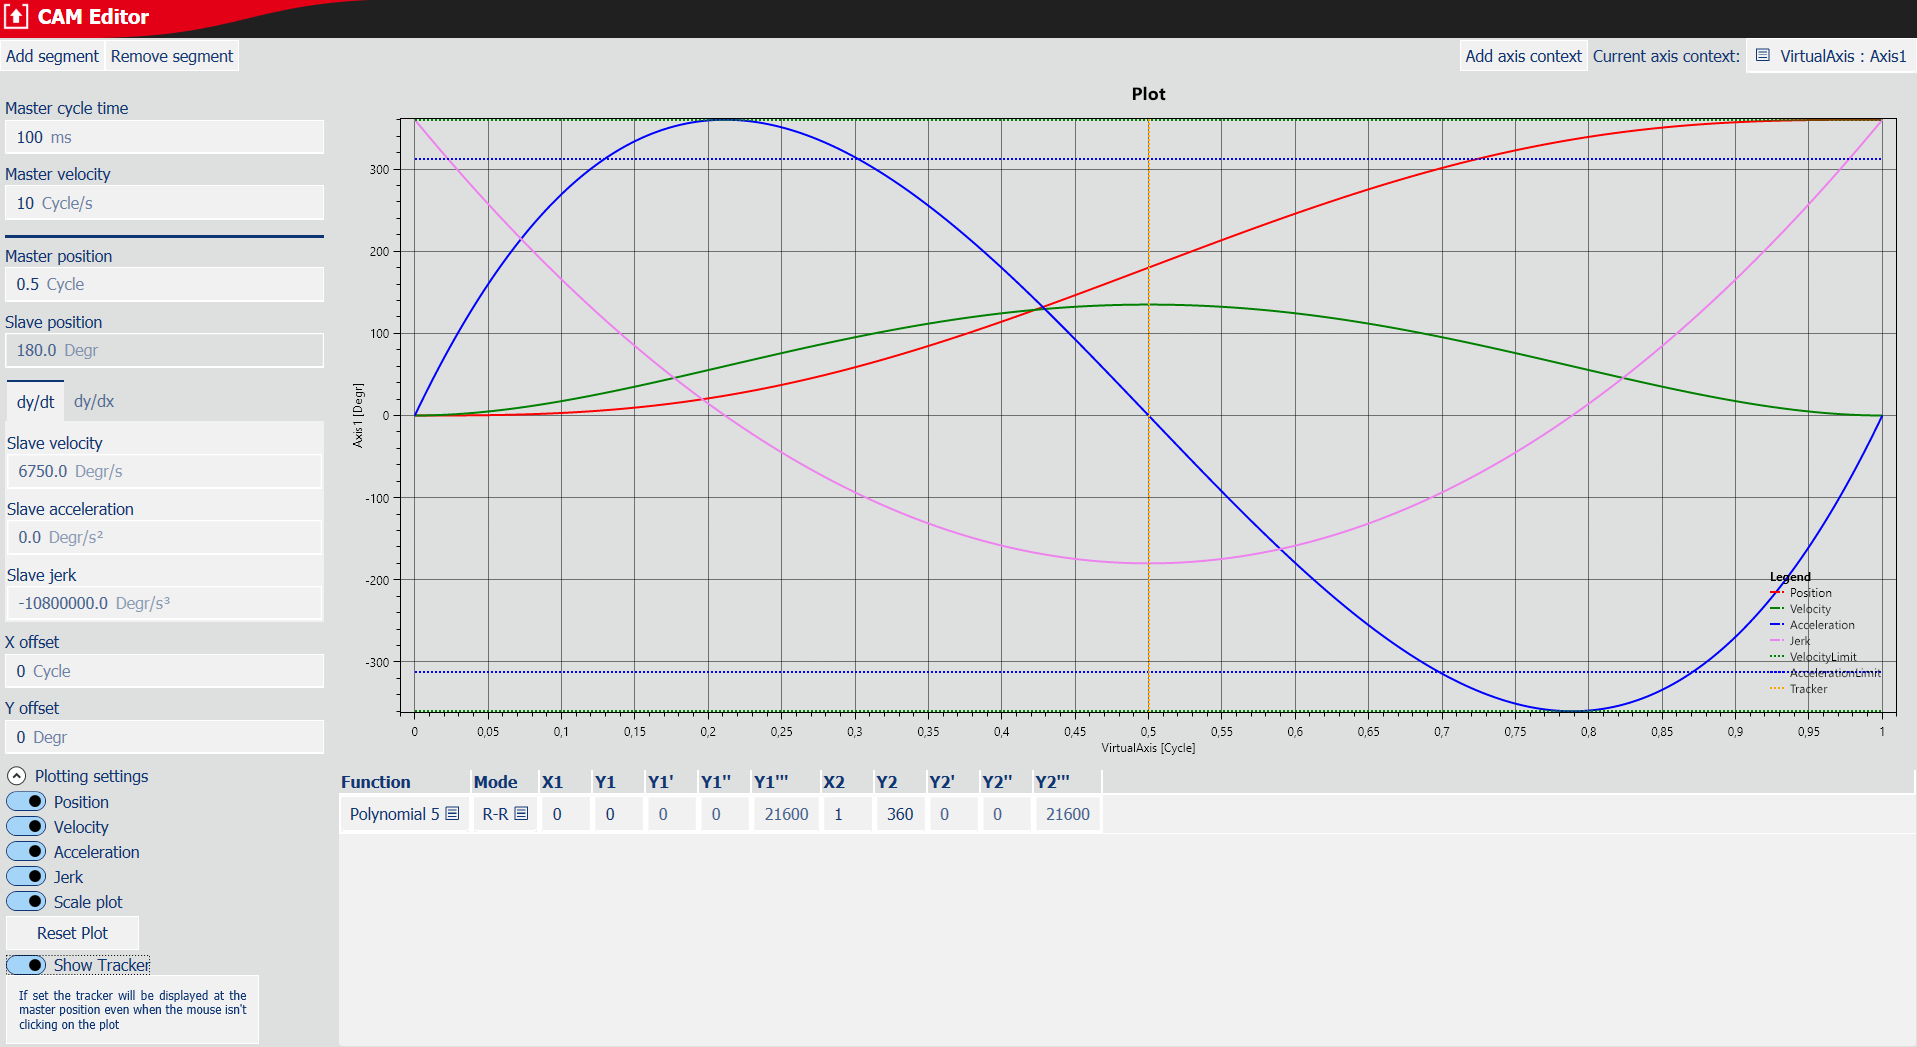
The slave values are displayed on the left-hand side, based on the specified "master cycle time" of 100 ms:
- Slave position: 180.0°
- Slave speed: 6750.0°/s.
- Slave acceleration: 0.0°/s/s.
Monitoring a variable in the online mode of the CAM Editor
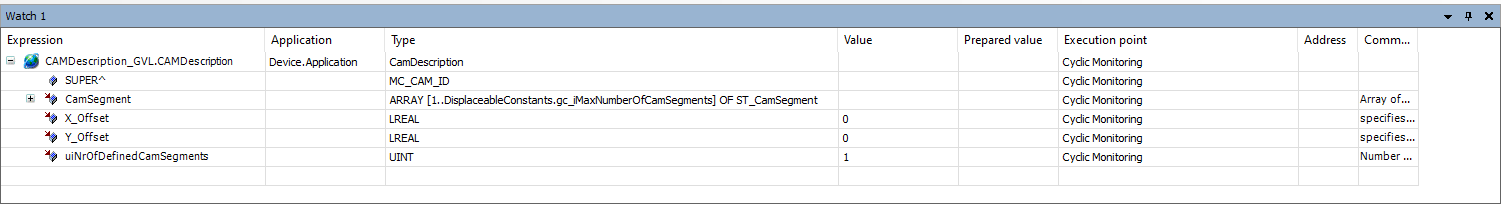
Each object of the type CAM Description is linked to a corresponding global variable that can be monitored within an observation window, for example. Proceed as follows to monitor the global variable:
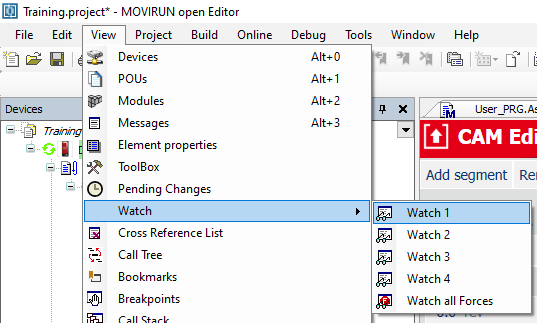
- Open a Watch window by selecting [View] > [Watch].
- The dialog box for configuring the Watch window opens.
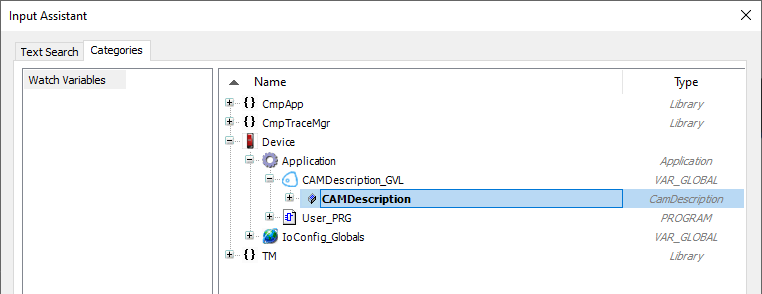
- Double-click [...] in the configuration menu of the Watch window to open the Input Assistant.
- Select the relevant variable in the Input Assistant.
- To be able to work online with the CAM Editor, the corresponding global variable must be used within the application program (e.g. as input MC_Camin.CamTableID).
When the CAM Editor is opened online, an empty display is initially visible. This is because the CAM Editor does not constantly read the corresponding global variable. In addition, the user can write to this variable from the user program so that the CAM Editor does not know at what point it makes sense to read the variable in order to obtain consistent data. The user must therefore initiate the readout of the data via the [Read CAM Description] button. The CAM Editor then attempts to display the content of the corresponding global variable.
In particular, if the cam description from the application program is changed, there is a risk that inconsistent data will be assigned. For example, the number of cam segments defined in the cam description CamDescription.uiNumberOfDefinedCamSegments could be 0 or greater than the maximum possible number (20), or the right limit of a cam segment, CamSegment[n].Right.lrx, could be assigned a smaller value than the left limit, CamSegment[n].Left.lrX. In these cases, the plot remains empty even after executing [Read CAM Description].
After reading the CAM Description, the user can make changes. Changes only take effect after [Write CAM Description] is triggered. This is done for the same reasons as described above. It does not make sense to write permanently to the global variable or to write with every single change. Only the user knows when the changes have been completed and a CAM Description should be written.
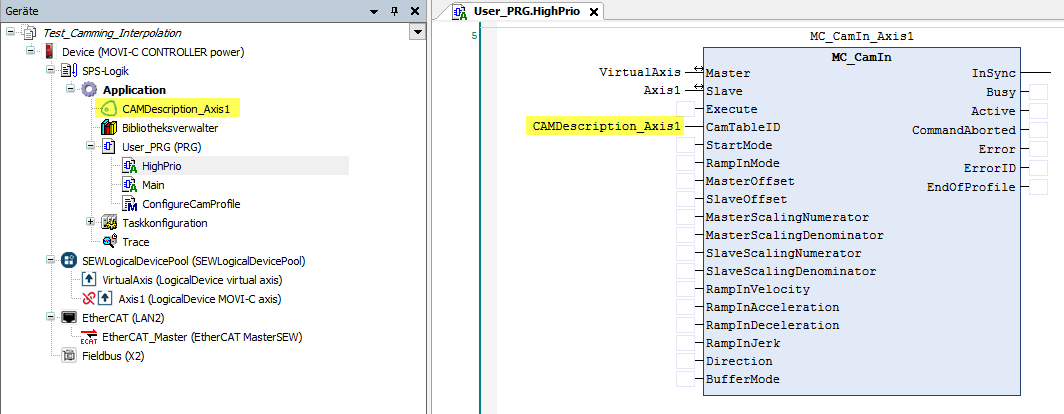
The cam description configured in this way is transferred as CamTableID when the MC_CamIn function block is called.